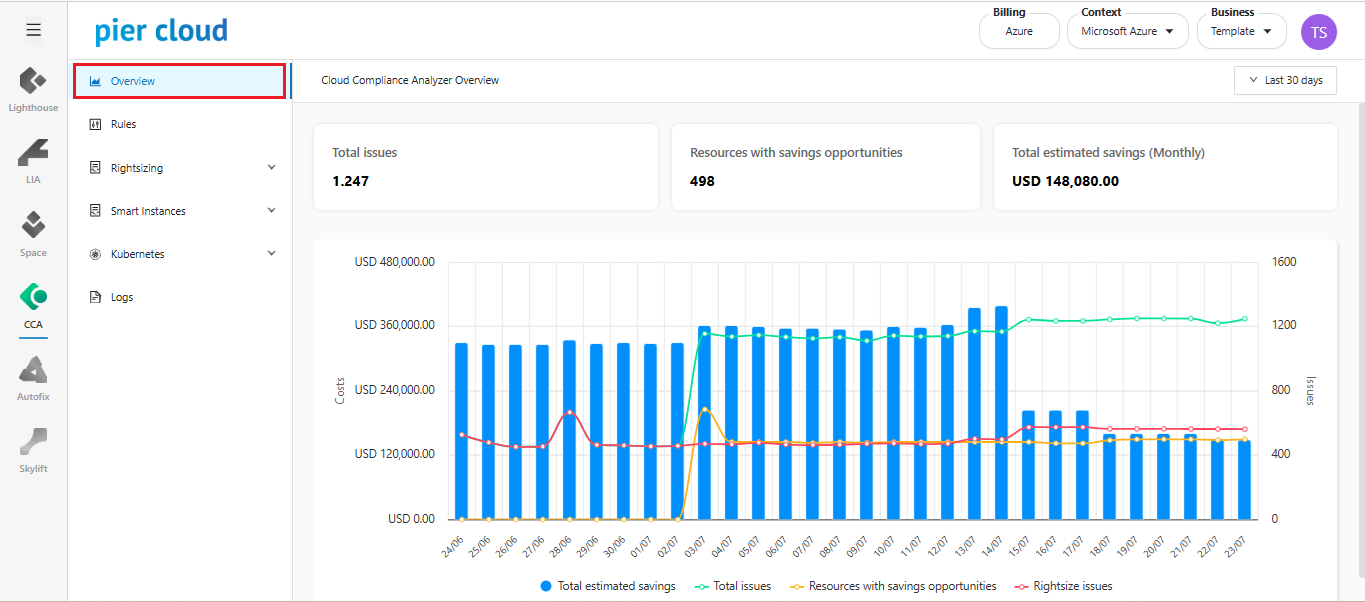
# Overview

In the Overview, you can get a general view of the CCA analyses, such as the **total number of issues**, **resources with cost-saving opportunities**, and the **estimated (monthly) savings potential**. Below, we will explain each view in more detail.

This feature is important to have a preview of the opportunities that are available for carrying out savings actions.

\*Estimated monthly savings cost is the monthly savings cost based on an estimate of actions taken monthly.

**How to get to the Overview:**

1. In the CCA side feature menu, select Overview.

<figure><img src="https://1687673077-files.gitbook.io/~/files/v0/b/gitbook-x-prod.appspot.com/o/spaces%2FZ9sinLUl52lDK1vg6b8g%2Fuploads%2FglOU8rfRIerenizFu07y%2Fimage.png?alt=media&#x26;token=9bb3956c-7109-4a3a-a90a-516200fb9722" alt=""><figcaption></figcaption></figure>

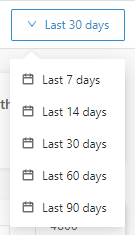
2. Select the period you want.

<figure><img src="https://1687673077-files.gitbook.io/~/files/v0/b/gitbook-x-prod.appspot.com/o/spaces%2FZ9sinLUl52lDK1vg6b8g%2Fuploads%2FNZ2OewsnaGRtlDZhRSSD%2Fimage.png?alt=media&#x26;token=d63e78bb-a3fe-4e92-93e5-8af1cf3b7868" alt=""><figcaption></figcaption></figure>

In the top box, select the period you want by moving the mouse over the period box, which will open with the possible selection periods.

<figure><img src="https://1687673077-files.gitbook.io/~/files/v0/b/gitbook-x-prod.appspot.com/o/spaces%2FZ9sinLUl52lDK1vg6b8g%2Fuploads%2FWdlNh73hJkdEhGhAoPSi%2Fimage.png?alt=media&#x26;token=f3901c1a-1105-4acf-86f0-b757cca72d0b" alt=""><figcaption></figcaption></figure>

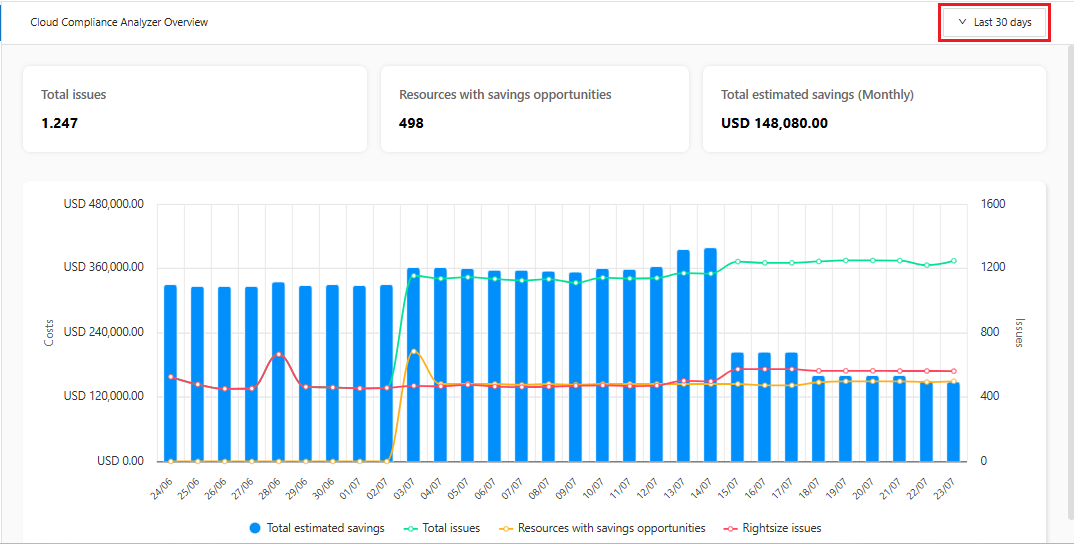
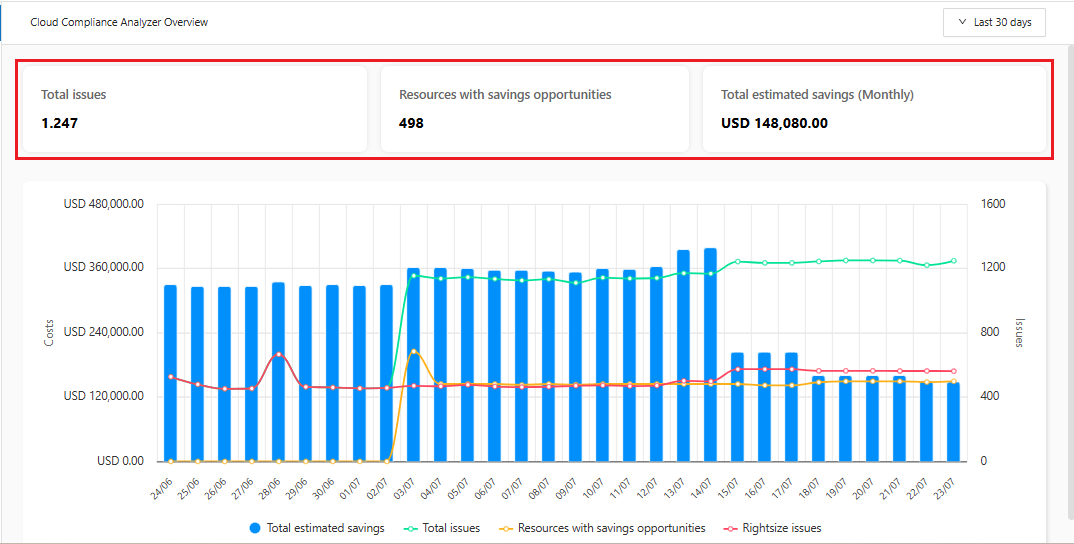
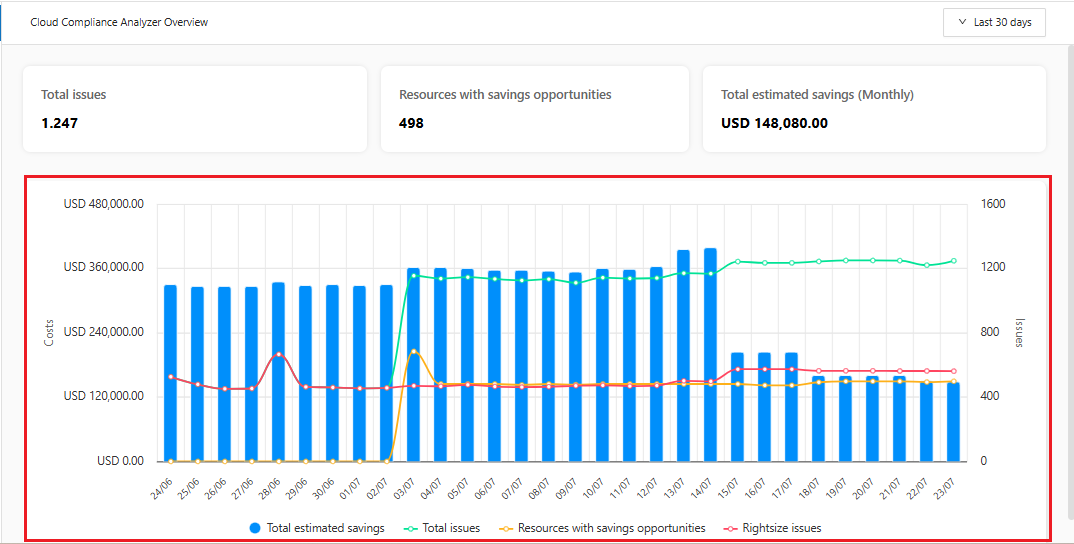
3. CCA Overview board.

* **Total issues:** Indicates the total number of actions that can be carried out within the CCA recommendations.&#x20;
* **Resources with savings opportunities:** Indicates the amount of resources that are available with savings opportunities if the action is executed.&#x20;
* **Total estimated savings (Monthly):** Monthly savings to be realized by implementing recommended opportunities. Savings are estimated based on usage over the last 30 days.

<figure><img src="https://1687673077-files.gitbook.io/~/files/v0/b/gitbook-x-prod.appspot.com/o/spaces%2FZ9sinLUl52lDK1vg6b8g%2Fuploads%2FMFduOkhsFZuJcyHZEMxb%2Fimage.png?alt=media&#x26;token=2218d64f-c77e-4623-b5a2-9722641cbe32" alt=""><figcaption></figcaption></figure>

4. Monthly view of savings estimates.

The blue bar graph indicates the **monthly** savings amount that was related to the chosen day.

<figure><img src="https://1687673077-files.gitbook.io/~/files/v0/b/gitbook-x-prod.appspot.com/o/spaces%2FZ9sinLUl52lDK1vg6b8g%2Fuploads%2FJn7480OosFjGRpJWa21M%2Fimage.png?alt=media&#x26;token=663a0969-5e83-44c1-89bf-3f9011334b94" alt=""><figcaption></figcaption></figure>

<br>
