# Overview

In the **Overview** it is possible to have an overview of **Clusters**, **Namespaces** and **Applications**, in addition to the **Allocated Cost, CPU and Memory Cost used** and **Network Cost**.

**How to get to Overview:**

1. In Kubernetes, select the **Overview** option.

<figure><img src="https://1687673077-files.gitbook.io/~/files/v0/b/gitbook-x-prod.appspot.com/o/spaces%2FZ9sinLUl52lDK1vg6b8g%2Fuploads%2FBizByj0fzJxC6p82UFoh%2Fimage.png?alt=media&#x26;token=8eed26a5-b0f5-4ce8-8978-11ff580344d0" alt=""><figcaption></figcaption></figure>

2. Select the desired period.

<figure><img src="https://1687673077-files.gitbook.io/~/files/v0/b/gitbook-x-prod.appspot.com/o/spaces%2FZ9sinLUl52lDK1vg6b8g%2Fuploads%2FH0vir1bYszKM7dV1knST%2Fimage.png?alt=media&#x26;token=4ca4cca9-4fc4-4a27-afad-72ccaf7b925a" alt=""><figcaption></figcaption></figure>

In the top bar, select the desired period by hovering the mouse over the period box, which will open in the current month. You can move forward or backward through the months by clicking on the single arrow, or through the years by clicking on the double arrow, highlighted below:

<figure><img src="https://1687673077-files.gitbook.io/~/files/v0/b/gitbook-x-prod.appspot.com/o/spaces%2FZ9sinLUl52lDK1vg6b8g%2Fuploads%2FL5OGsirVT88vbU1m9HJf%2Fimage.png?alt=media&#x26;token=679b9a60-c807-4575-aacf-75a2e1a4ea2c" alt="" width="464"><figcaption></figcaption></figure>

After selecting the desired period, clicking on the Reload button, the system will update the data returned according to the period informed.

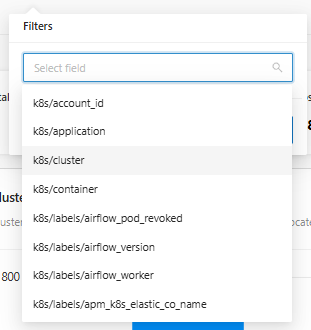
3. By clicking on the **Filters** icon, as shown below:

<figure><img src="https://1687673077-files.gitbook.io/~/files/v0/b/gitbook-x-prod.appspot.com/o/spaces%2FZ9sinLUl52lDK1vg6b8g%2Fuploads%2FW7YUMW7yKMVD85c24oGx%2Fimage.png?alt=media&#x26;token=627d2650-e095-4cdc-8a56-4741ec1cd4bb" alt=""><figcaption></figcaption></figure>

The system will display all label options collected from the observability platform, allowing you to apply the desired filter field to K8s:

<figure><img src="https://1687673077-files.gitbook.io/~/files/v0/b/gitbook-x-prod.appspot.com/o/spaces%2FZ9sinLUl52lDK1vg6b8g%2Fuploads%2FRlyPkYKMx9wKtL0VR88l%2Fimage.png?alt=media&#x26;token=573997b1-aacb-4aa2-8c66-093efece7b77" alt="" width="233"><figcaption></figcaption></figure>

When selecting the desired field, you will be able to provide more information about the filter field, such as:

* Enable the **negative expressions** option if you want to work with a result different from the one reported.
* **Is equal to**: In this case, the desired value must be selected in the return.
* **Is empty**: When an empty result is desired for my return.
* **Contains**: When you want the result to contain a specific value to be reported.
* **Starts with**: When you want the result to start with a specific value to be reported.
* **Ends with**: When you want the result to end with a specific value to be reported.

<figure><img src="https://1687673077-files.gitbook.io/~/files/v0/b/gitbook-x-prod.appspot.com/o/spaces%2FZ9sinLUl52lDK1vg6b8g%2Fuploads%2F4ams9l42ydSI01JUzVVI%2Fimage.png?alt=media&#x26;token=f0b86fa8-142d-4d3b-afe7-6d4a5efed2d7" alt="" width="233"><figcaption></figcaption></figure>

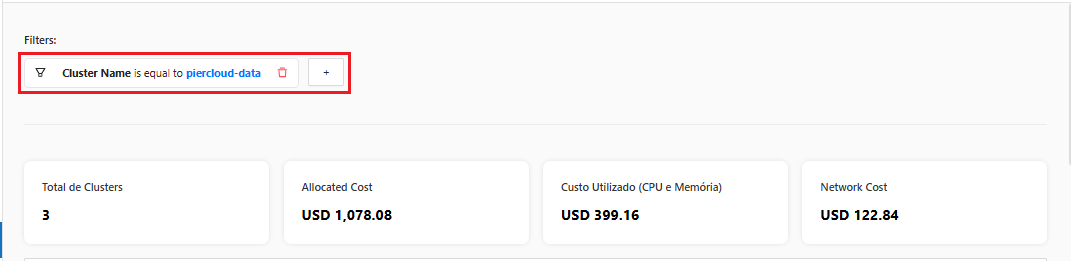
Finally, by clicking the **Save** button, the system will display the added filter:

<figure><img src="https://1687673077-files.gitbook.io/~/files/v0/b/gitbook-x-prod.appspot.com/o/spaces%2FZ9sinLUl52lDK1vg6b8g%2Fuploads%2FFZ1VHM3NNwixuIrXw0KH%2Fimage.png?alt=media&#x26;token=70425fbe-8429-4244-be38-4b30484b8686" alt=""><figcaption></figcaption></figure>

4. Cluster Overview Board.

* **Cluster Total**: Indicates the total Kubernetes Cluster.
* **Allocated Cost:** Indicates the total cost that was actually paid within the Kubernetes Clusters.
* **Cost Used (CPU and Memory)**: Indicates the total cost of CPU and Memory that was actually used.
* **Network Cost**: Indicates the cost that was paid for network traffic on Kubernetes nodes.

<figure><img src="https://1687673077-files.gitbook.io/~/files/v0/b/gitbook-x-prod.appspot.com/o/spaces%2FZ9sinLUl52lDK1vg6b8g%2Fuploads%2FdHHSVjR2gmSWvG2qLmHn%2Fimage.png?alt=media&#x26;token=7487e271-778a-4c61-9895-42d3e5bc880e" alt=""><figcaption></figcaption></figure>
