# Report

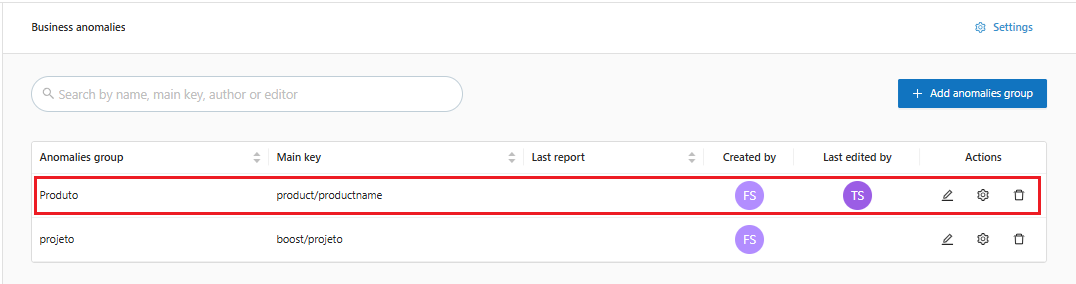
1. On the main **Business Anomaly** screen, in the Anomaly Groups list, when clicking on the line of the desired group, as highlighted below:

<figure><img src="https://1687673077-files.gitbook.io/~/files/v0/b/gitbook-x-prod.appspot.com/o/spaces%2FZ9sinLUl52lDK1vg6b8g%2Fuploads%2FZLn9m9gRAJ5vbmiuB1Tz%2Fimage.png?alt=media&#x26;token=c34b5083-6374-40bd-b68d-8bdf16277ea8" alt=""><figcaption></figcaption></figure>

2. The system will display a screen with details of the registered anomaly group, where the following information will be displayed:

* **Number of Enabled Models**: Number of models enabled for the selected anomaly group.
* **Anomalies from the last report**: Number of anomalies presented in the last report.
* **Total Deviations**: Total value of the deviation in dollars.

<figure><img src="https://1687673077-files.gitbook.io/~/files/v0/b/gitbook-x-prod.appspot.com/o/spaces%2FZ9sinLUl52lDK1vg6b8g%2Fuploads%2FDs0R5nLbvPkK90TJgmqx%2F%7B2EB26A36-A2B4-4F1E-9051-226B942D67E0%7D.png?alt=media&#x26;token=e76ee934-4218-422e-8550-8a24ffb33174" alt=""><figcaption></figcaption></figure>

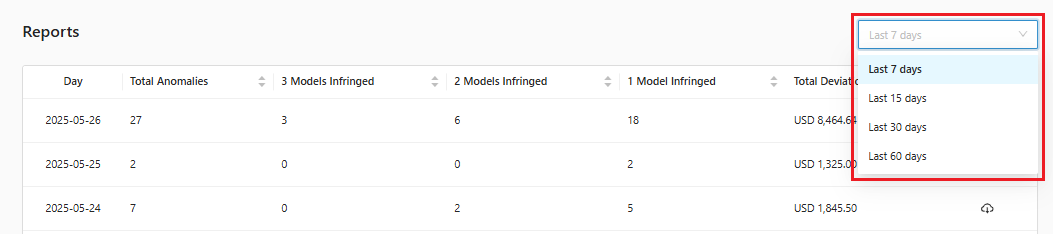
* In addition to a report that can be filtered by a specific period, as highlighted below:

<figure><img src="https://1687673077-files.gitbook.io/~/files/v0/b/gitbook-x-prod.appspot.com/o/spaces%2FZ9sinLUl52lDK1vg6b8g%2Fuploads%2F8F7DEdIZyl1O7FqPAlbQ%2Fimage.png?alt=media&#x26;token=99ce2b05-00b4-43f7-9462-b5dc16314748" alt=""><figcaption></figcaption></figure>

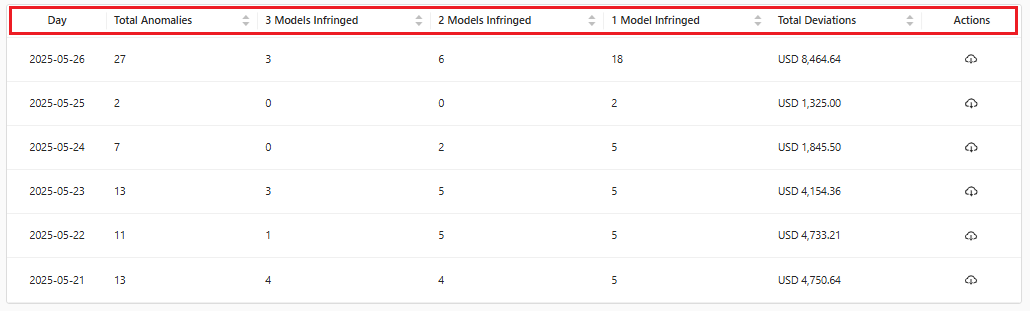
* And an anomaly report for each day in the filtered period, containing the day, number of anomalies detected, number of models Infringed and the total deviations in dollars.

<figure><img src="https://1687673077-files.gitbook.io/~/files/v0/b/gitbook-x-prod.appspot.com/o/spaces%2FZ9sinLUl52lDK1vg6b8g%2Fuploads%2F2pOJeH1JeSJdDQoGqSQw%2Fimage.png?alt=media&#x26;token=bf0b4e60-79a0-4346-b47b-06cdce4d43eb" alt=""><figcaption></figcaption></figure>

* **Action**: For each day in the report, the system allows you to **download the report**, in CSV format, by clicking on the "![](https://1687673077-files.gitbook.io/~/files/v0/b/gitbook-x-prod.appspot.com/o/spaces%2FZ9sinLUl52lDK1vg6b8g%2Fuploads%2FZXpWZKvOZ8hpTg0OB4oN%2Fimage.png?alt=media\&token=3cee4209-6c74-4c04-9887-ddd2bfbbc6bb)" icon, as highlighted below:

<figure><img src="https://1687673077-files.gitbook.io/~/files/v0/b/gitbook-x-prod.appspot.com/o/spaces%2FZ9sinLUl52lDK1vg6b8g%2Fuploads%2FAayuSzOVfqKg7ZpdgmP8%2Fimage.png?alt=media&#x26;token=1479f95b-1ef4-4777-9169-cd807ec2d431" alt=""><figcaption></figcaption></figure>

3. For each line of the report, click on the line corresponding to the desired day, as highlighted below:

<figure><img src="https://1687673077-files.gitbook.io/~/files/v0/b/gitbook-x-prod.appspot.com/o/spaces%2FZ9sinLUl52lDK1vg6b8g%2Fuploads%2FYnmws25SLxs3otB3YLZt%2Fimage.png?alt=media&#x26;token=302142b0-9793-4847-b383-d0353d75526f" alt=""><figcaption></figcaption></figure>

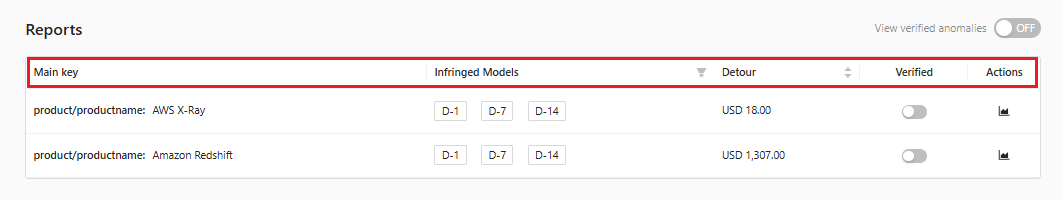
3. The system will display a detailed screen of the anomalies identified for the specific day, containing the following information:

* **Number of Enabled Models**: Number of models enabled for the anomalies of the respective day.
* **Anomalies found**: Number of anomalies identified on the respective day.
* **Total Deviations**: Total value of the deviation in dollars.

<figure><img src="https://1687673077-files.gitbook.io/~/files/v0/b/gitbook-x-prod.appspot.com/o/spaces%2FZ9sinLUl52lDK1vg6b8g%2Fuploads%2FTBKoyHrX9yJ0yrQTsXje%2Fimage.png?alt=media&#x26;token=ca4f17f5-d785-4747-8564-21e3bac32d44" alt=""><figcaption></figcaption></figure>

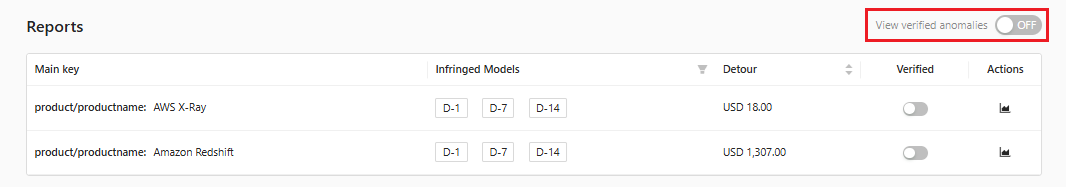
* In addition to a report that allows you to view anomalies marked as verified or not, by clicking on the option highlighted below:

<figure><img src="https://1687673077-files.gitbook.io/~/files/v0/b/gitbook-x-prod.appspot.com/o/spaces%2FZ9sinLUl52lDK1vg6b8g%2Fuploads%2Ff1aoWiWtD2nUemieyqHo%2Fimage.png?alt=media&#x26;token=955d83fd-6f24-4ecd-90f0-9c444ec79296" alt=""><figcaption></figcaption></figure>

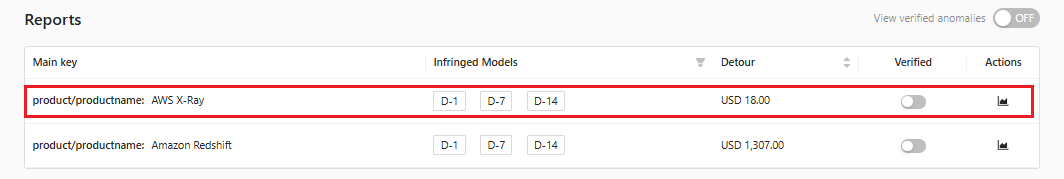
* And an anomaly report, containing the **main key**, the **violated models** and the total **deviations** in dollars.

<figure><img src="https://1687673077-files.gitbook.io/~/files/v0/b/gitbook-x-prod.appspot.com/o/spaces%2FZ9sinLUl52lDK1vg6b8g%2Fuploads%2FQq5lL12AvPWjo4ESzxOv%2Fimage.png?alt=media&#x26;token=9de930a5-098e-46ec-b46a-ebd3b8336da3" alt=""><figcaption></figcaption></figure>

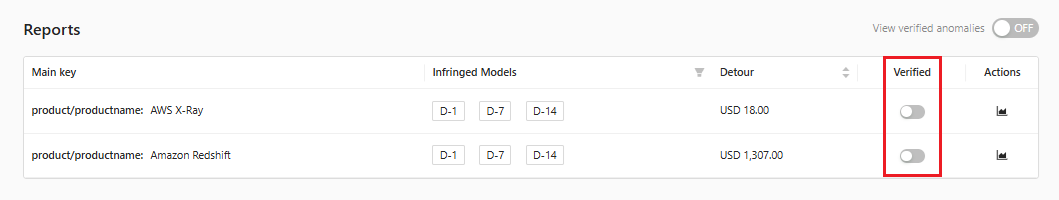
* **Verified**: In the verified column, the system allows you to see whether that anomaly is already marked as verified or not, in addition to allowing you to flag it as verified by clicking on the "![](https://1687673077-files.gitbook.io/~/files/v0/b/gitbook-x-prod.appspot.com/o/spaces%2FZ9sinLUl52lDK1vg6b8g%2Fuploads%2F0gzQfrUibURTsEDLuCc8%2F%7B537C9DCE-D0B1-4F87-908D-16B9E4957B5B%7D.png?alt=media\&token=a9189cd8-7a56-431a-98f2-168c458c76c3)" icon, if necessary:

<figure><img src="https://1687673077-files.gitbook.io/~/files/v0/b/gitbook-x-prod.appspot.com/o/spaces%2FZ9sinLUl52lDK1vg6b8g%2Fuploads%2F72GtdlM2aMVuOc4aBIK1%2Fimage.png?alt=media&#x26;token=0b34f174-bbc5-48e8-a93b-7c87adf95a49" alt=""><figcaption></figcaption></figure>

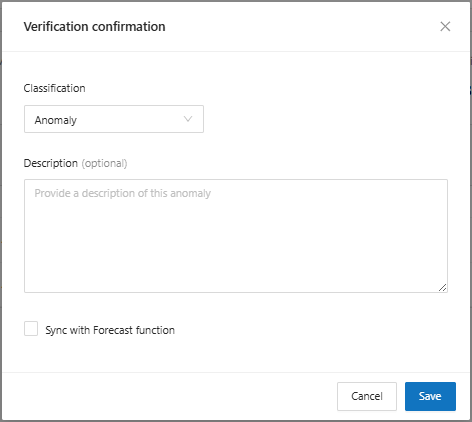
On the screen displayed, enter the **Classification**:

* **Anomaly**: Behavior outside the expected pattern.
* **False Positive**: Alert generated by something legitimate identified as a threat.
* **Expected Behavior**: When it is a behavior that is different from normal, but expected by the system due to a specific moment/event.

Enter the **Description** and then click the **Save** button.

<figure><img src="https://1687673077-files.gitbook.io/~/files/v0/b/gitbook-x-prod.appspot.com/o/spaces%2FZ9sinLUl52lDK1vg6b8g%2Fuploads%2FN0kXXidaqactxBSqdQZv%2Fimage.png?alt=media&#x26;token=74cecfc7-4a8b-4153-8a28-7fb66f0d710c" alt=""><figcaption></figcaption></figure>

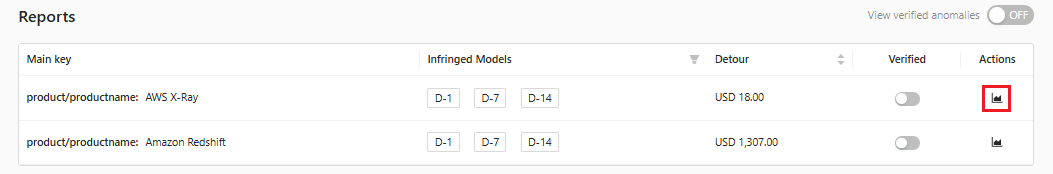
* **Action**: For each anomaly, clicking on the "![](https://1687673077-files.gitbook.io/~/files/v0/b/gitbook-x-prod.appspot.com/o/spaces%2FZ9sinLUl52lDK1vg6b8g%2Fuploads%2FCbSVRoqWEjX8U1wO0xkl%2F%7B225B056E-2595-4B7E-980B-395728F5D78C%7D.png?alt=media\&token=8b9d95f0-f552-4a75-95bb-cec9bce5591e)" icon, as highlighted below:

<figure><img src="https://1687673077-files.gitbook.io/~/files/v0/b/gitbook-x-prod.appspot.com/o/spaces%2FZ9sinLUl52lDK1vg6b8g%2Fuploads%2F1oaOsgYfObw667C1VLlo%2Fimage.png?alt=media&#x26;token=b692470a-25ec-4006-b547-eaaf3fe4cac6" alt=""><figcaption></figcaption></figure>

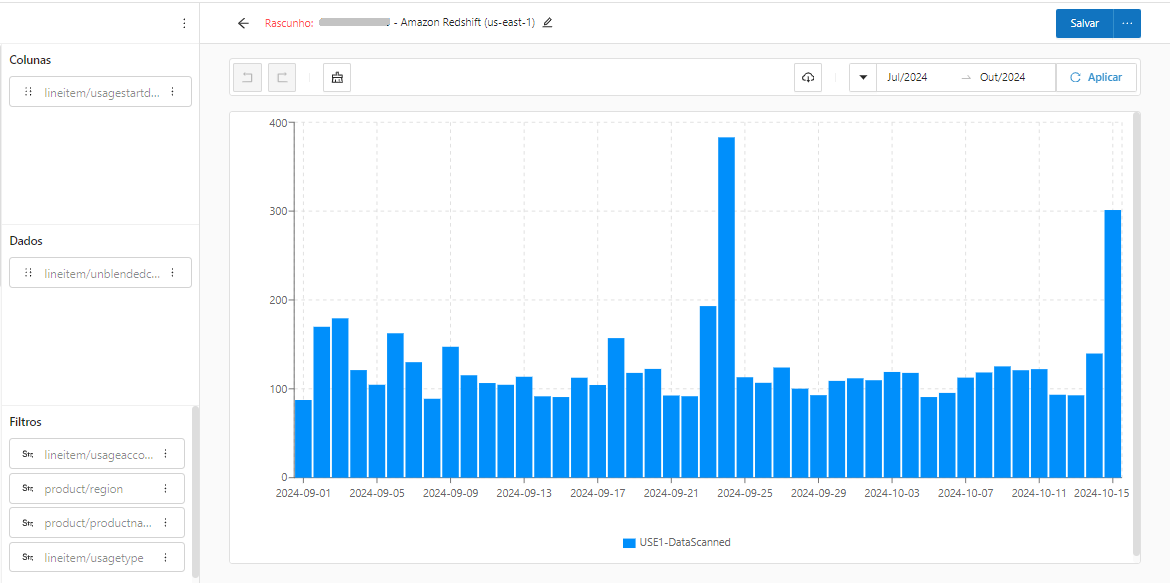
The system allows you to open the view generated in the Workspace and make adjustments, if necessary:

<figure><img src="https://1687673077-files.gitbook.io/~/files/v0/b/gitbook-x-prod.appspot.com/o/spaces%2FZ9sinLUl52lDK1vg6b8g%2Fuploads%2FYyKiFqUlZ66P0J7Ul5yk%2Fimage.png?alt=media&#x26;token=f8dc125e-4e4f-42d3-93dd-30df8e50416e" alt=""><figcaption></figcaption></figure>

{% hint style="info" %}
For each anomaly view generated, some default filter options will be applied, which can be customized as needed:

* lineitem/lineitemtype
* lineitem/usageaccountid
* product/region
* product/productname
* lineitem/usagetype
  {% endhint %}

4. Clicking on the line corresponding to the desired anomalies, as highlighted below:

<figure><img src="https://1687673077-files.gitbook.io/~/files/v0/b/gitbook-x-prod.appspot.com/o/spaces%2FZ9sinLUl52lDK1vg6b8g%2Fuploads%2FusNwrzf4ZbBkjyD5Npdt%2Fimage.png?alt=media&#x26;token=46e1ed84-a44e-4d74-9ba8-4dd818b30fee" alt=""><figcaption></figcaption></figure>

5. The system will open a detailed description of the anomaly containing the following information:

* **Details**:
  * Main key;
  * Main key value;
  * Status.
* **Infringed Models:**
  * Models;
  * Expected Cost;
  * Increase in dollar ($)
  * Percentage Increase (%)
* In addition to notes containing the classification of the anomaly.

<figure><img src="https://1687673077-files.gitbook.io/~/files/v0/b/gitbook-x-prod.appspot.com/o/spaces%2FZ9sinLUl52lDK1vg6b8g%2Fuploads%2FnFTYKBUxMkNcJcNlbsI2%2Fimage.png?alt=media&#x26;token=3dd6a97d-b609-48df-ac09-2cefdb4c0f46" alt=""><figcaption></figcaption></figure>
