# Build Visualization
**How to build a Visualization**
The next steps will help you understand the mechanism for creating graphical visualizations and the data available for this construction.
**Step 1**: In Workspaces, select the desired workspace;
**Step 2**: Inside the Workspace, select **New View**;
Once this is done, we will see the view editing screen.
In “**Fields**” we will see all the provider’s billing fields. To understand, access each provider’s API documentation.
**AWS**: To access the AWS Field Dictionary documentation, click [here](https://docs.piercloud.com.br/plataforma-de-finops/finops-platform-english/products/lighthouse/workspaces/provider-field-dictionary/aws-field-dictionary)!
**Azure**: To access the Azure Field Dictionary documentation, click [here](https://docs.piercloud.com.br/plataforma-de-finops/finops-platform-english/products/lighthouse/workspaces/provider-field-dictionary/azure-field-dictionary)!
**GCP**: To access the GCP Field Dictionary documentation, click [here](https://docs.piercloud.com.br/plataforma-de-finops/finops-platform-english/products/lighthouse/workspaces/provider-field-dictionary/gcp-field-dictionary)!
**OCI**: To access the OCI Field Dictionary documentation, click [here](https://docs.piercloud.com.br/plataforma-de-finops/finops-platform-english/products/lighthouse/workspaces/provider-field-dictionary/oci-field-dictionary)!
\
**Step 3**: **Configure the View data in the Fields tab**.
Click on the desired field and drag it to the **Columns, Data and Filters** areas.
**Columns**: Just like in a pivot table, the fields in this area will be displayed in the column positions;
**Data**: Used to perform mathematical operations (sum, average, lowest and highest value and count). When dragging a field to this area, the values will be aggregated according to the mathematical operations configured for each field in this area;
**Filters**: Fields used to filter the records in the view.
**Step 4: Edit the fields of a view**.
### **Columns area**:
On the Edit Columns screen, configure the fields in the **Settings, Format and Rank by** tabs:
* **Alias:** add a nickname to be displayed in the column
**Settings:**
* **Group by:** for date fields, it allows you to group records by periods: hour, day, week, biweekly, month or year;
* **Order:** configure the order in which data will be displayed: ascending, descending, or none.
**Format:**
* For **number** type fields**:**
* **Decimals**: Number of decimal places used in the display;
* **Unit**: Unit of measurement of the field in question (USD, BRL, MEX, CNY, EUR, ANG, COP, DOP, ARS, PEN, UYU, MB, GB, TB, Percent).
* **Notation**: Notation that can be used in the field (Compact and Scientific).
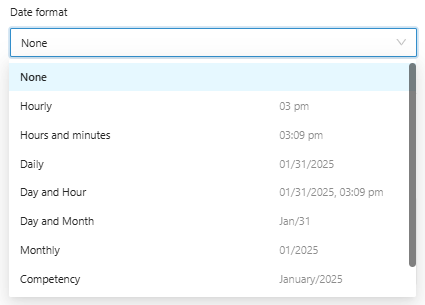
* For **date** type fields:
* **Date format**: Select a date format that will be used to display the date, according to the options (Hourly, Hours and minutes, Daily, Day and hour, Day and month, Monthly, Competency).
* For **string** type fields:
* **Decimals**: Number of decimal places used in the display;
* **Unit**: Unit of measurement of the field in question (USD, BRL, MEX, CNY, EUR, ANG, COP, DOP, ARS, PEN, UYU, MB, GB, TB, Percent).
* **Notation**: Notation that can be used in the field (Compact and Scientific).
* **Date format**: Select a date format that will be used to display the date, according to the options (Hourly, Hours and minutes, Daily, Day and hour, Day and month, Monthly, Competency).
**Rank by:**
* **Field:** Select the numeric field that will be used to obtain the number of lines for the item above;
* **Expression:** Select the mathematical operation that will be used to aggregate the data;
* **Quantity:** number of lines that will be displayed, for example, the 10 largest accounts;
* **Group surplus into Others:** The other items in the view will have their values added together in the "Others" item.
Once done, click **Save**.
### **Data Area**
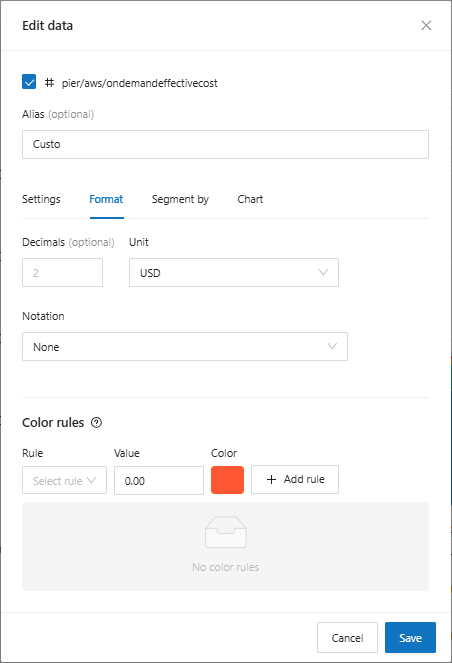
On the **Edit Data** screen, configure Data information in the **Settings**, **Format, Segment by** and **Chart** tabs.
**Settings:**
* **Expression**: Select the mathematical operation that will be used to aggregate the numerical data;
* **Order**: Option to sort the data display in ascending or descending order;
* **Orientation**: Chart axis, right or left.
* **Allow to show total**: When this option is enabled, the total value of this column will be displayed if total display is enabled on the chart.
**Format:**
* For **number** type fields**:**
* **Decimals**: Number of decimal places used in the display;
* **Unit**: Unit of measurement of the field in question (USD, BRL, MEX, CNY, EUR, ANG, COP, DOP, ARS, PEN, UYU, MB, GB, TB, Percent).
* **Notation**: Notation that can be used in the field (Compact and Scientific).
* For **date** type fields:
* **Date format**: Select a date format that will be used to display the date, according to the options (Hourly, Hours and minutes, Daily, Day and hour, Day and month, Monthly, Competency).
* For **string** type fields:
* **Decimals**: Number of decimal places used in the display;
* **Unit**: Unit of measurement of the field in question (USD, BRL, MEX, CNY, EUR, ANG, COP, DOP, ARS, PEN, UYU, MB, GB, TB, Percent).
* **Notation**: Notation that can be used in the field (Compact and Scientific).
* **Date format**: Select a date format that will be used to display the date, according to the options (Hourly, Hours and minutes, Daily, Day and hour, Day and month, Monthly, Competency).
* **Color rules**: To change the color, depending on the rule application.
* **Rule**: Select one of the rule options (between, greater than, less than, greater than or equal to, less than or equal to)
* **Value**: Enter the reference value for the rule
* **Color**: Select a color option to be applied when the rule is met
**Segment by:**
* **Prefix:** Enter the name corresponding to the field
* **Field**: Select the information that will group and summarize the values in your graph, for example, total by region;
* **Quantity**: Enter the number of items that will be displayed in the graph, for example the 10 largest values.
* Group surplus into **Others**: Select this option if you want to group the excess into a new type called *Others*.
* **Keep grouped**: Enable this option if you want the new columns to be grouped under the reference of the original column.
**Chart:**
* **View Type**: Select between line, area or bar chart.
### **Filters Area**
Use to filter the records in the view.
**Filter Combination:**
* **"Or" Operator**: Use for multiple selections, for example, filtering products "A", "B", "C"...
* **"And" Operator**: Use to combine more than one condition, for example, products that start with "F" and end with "2" or even products other than "A" and "B".
**Negative expressions**:
Check this option to invert the expression, for example, products different from "A" and "B".
Click **add** and then **save**.
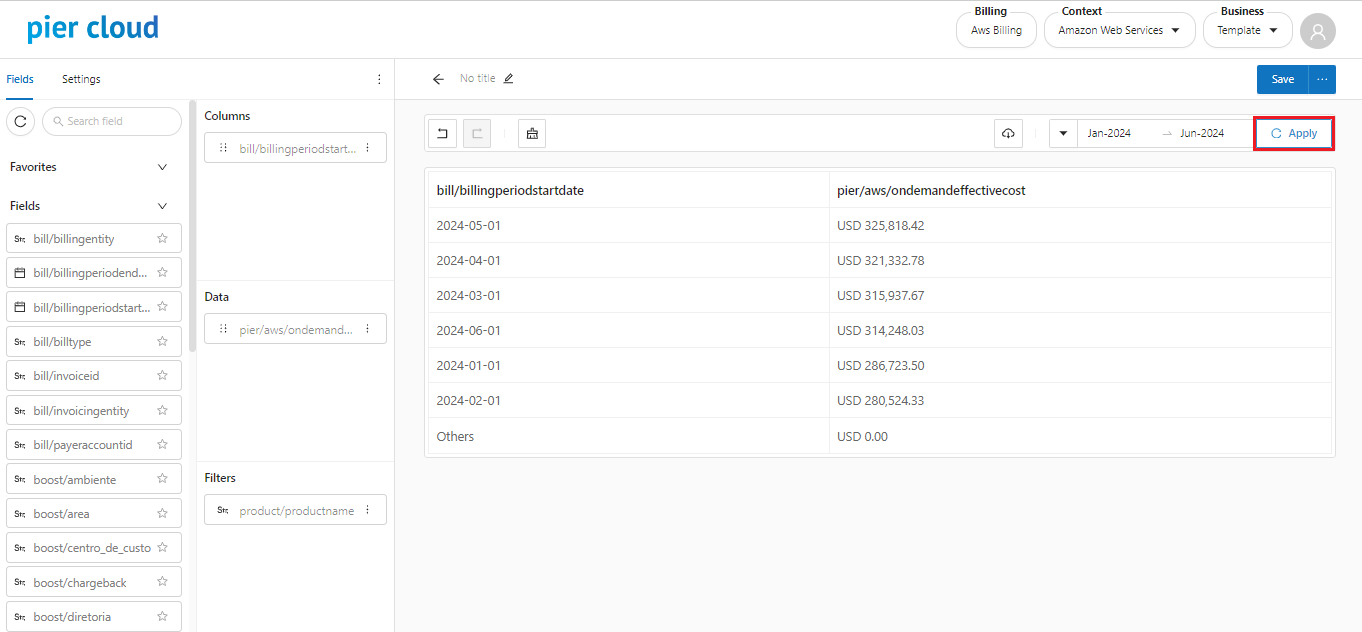
**Preview**
5. Clicking “**Apply**” will load the preview.
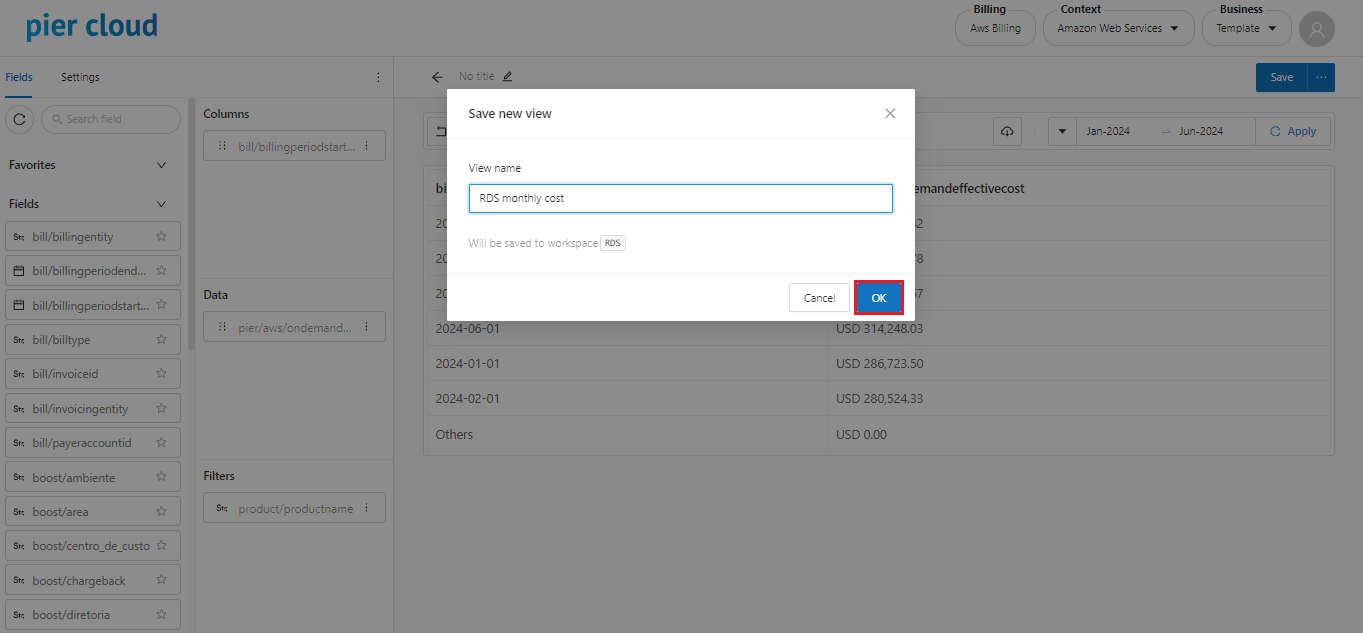
6. Clicking “**Save**” will take you to the naming part of the visualization title.
7. Click **OK** and the view has been created successfully.