# Configure View
After setting up the view with the necessary fields, the system allows you to customize the configuration in the "Settings" tab:
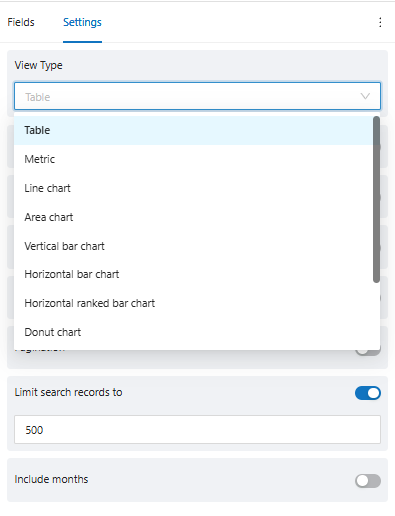
In the **view type**, it is possible to customize how you want to view the information.
For each view type, the system will update the following configuration fields, according to the chosen view.
* **Table**: To display information in table format.
* **Metric**: To display information in number format, often used to display information as a Total value.
* **Line chart**: To display information in a horizontal line chart format
* **Area chart**: To display information in an area chart format, where each area corresponds to a color in the legend
* **Vertical bar chart**: To display information in a vertical bar chart format, often used when it is necessary to display information from top to bottom
* **Horizontal bar chart**: To display information in a horizontal bar chart format, often used when it is necessary to display information on a timeline
* **Ranked bar chart**: To display information in a ranked bar chart format, often used when it is necessary to display a ranking of values.
* **Donut chart**: To display information in a donut format, differentiating the parts by color.
* **Pie chart**: Para exibir a informação em formato de pizza, diferenciando as fatias por cor.
* **Bubbles chart**: To display information in bubble format, differentiating the bubbles by color.